How conversation clusters reveal the patterns from customers that truly shape buying decisions
Understanding consumers today requires far more than tracking mentions, sentiment, or volume. Traditional metrics tell us what people say, but rarely how those conversations relate to each other or why they take the shape they do.
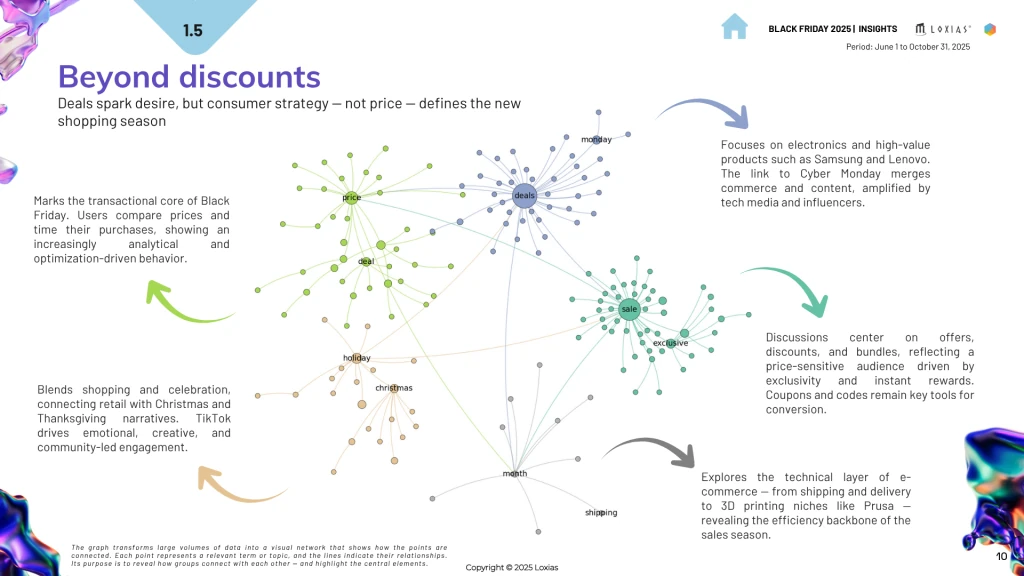
In an environment where platforms, emotions, and cultural signals shift faster than most brands can follow, the real insight lies in seeing connections, not isolations, this is where affinity graphs become essential.
Affinity graphs map the way conversations naturally cluster around shared meanings, needs, fears, cultural references, and behavioral triggers. Instead of treating each topic independently, they show how ideas move together, revealing the hidden logic behind consumption.
In our Black Friday 2025 Study, affinity graphs played a central role in understanding the forces shaping one of the world’s most competitive shopping moments. What emerged wasn’t a list of keywords or trending products, but a behavioral landscape.
This article explores why that matters.
What Are Affinity Graphs, Really?
Affinity graphs visualize how different conversation nodes, words, themes, products, emotions, or cultural signals, connect to one another.
Rather than organizing data by category (Electronics vs. Fashion vs. Games), affinity graphs organize it by meaning, clustering conversations around deeper drivers such as:
- Comfort and security
- Aspirational identity
- Value vs. risk perception
- Trust and credibility
- Cultural belonging
- Future orientation or uncertainty
This shift is crucial. People rarely purchase based on category alone. They buy based on what a product represents within their own emotional and cultural context.
Affinity graphs make that visible.
What Affinity Graphs Revealed About Black Friday 2025
When our team at Loxias AI analyzed millions of mentions across social media, podcasts, news, videos, and online communities, the affinity graphs exposed something that traditional dashboards tend to hide:
Consumers don’t behave like categories, they behave like clusters.
We saw Electronics intertwined with Home & Living around themes of comfort, routine, and efficiency.
Beauty and Wellness merged in clusters tied to self-care and identity.
Travel connected with Experiences and even Food & Beverage through aspiration, escape, and emotional reward.
In other words: Products compete less with “competitors” and more with the meanings people attach to them. This explains why a home appliance might compete emotionally with a wellness product, or why fashion posts spike during conversations about self-confidence and belonging. Affinity graphs helped uncover these unexpected relationships, that shape actual consumer behavior.
Why these clusters matter for brands
Marketing strategies often fall short because they focus on product categories instead of understanding the mental and emotional journeys that lead to a purchase. Affinity graphs fix that gap.
1. They reveal decision drivers that metrics miss
Instead of “people are talking about electronics,” the insight becomes: People are talking about comfort, reliability, and time-saving, and electronics happen to be part of that narrative, the emotional context changes everything.
2. They show how people compare brands that don’t compete on paper
Consumers don’t draw industry boundaries, they compare anything that solves a similar emotional tension. A smartwatch might compete with a skincare product, not for function, but for identity reinforcement.
3. They reveal trust dynamics across platforms
Our Black Friday 2025 analysis showed that over half of the buzz now occurs on TikTok and podcasts, spaces of authenticity and community.
Affinity graphs help map:
- Who people trust
- Where narratives gain traction
- How trust clusters influence purchase decisions
This helps brands reposition where and how they show up.
4. They help brands understand their cultural position
A brand isn’t just part of a market; it’s part of a cultural map.
Affinity graphs show where the brand sits within:
- Conversations of belonging
- Conversations of uncertainty
- Conversations about value or aspiration
This informs communication, not just performance.
Why Affinity Graphs Matter More Than Ever in 2025
Consumer behavior is increasingly shaped by:
- Fragmented attention
- Cultural polarization
- Economic pressure
- Influencer-driven trust
- Platform-specific behaviors
- Emotional fatigue
- Desire for meaning and connection
Affinity graphs help decode these variables by showing how they flow together. Instead of reactive marketing, they enable anticipatory intelligence, reveal what people genuinely care about, and the storyline behind the spikes.
Want to See the Full Affinity Graphs and Consumer Clusters?
The complete analysis is available in our Black Friday 2025 Study, with 50+ pages of intelligence, conversation maps, methodologies, and behavioral insights.
Download it for free:
https://content.loxias.ai/black-friday2025-US/
Want to see a sample? Check here: