Discover how graph-based analysis transforms social listening by revealing hidden patterns, mapping conversations, and guiding smarter business decisions.
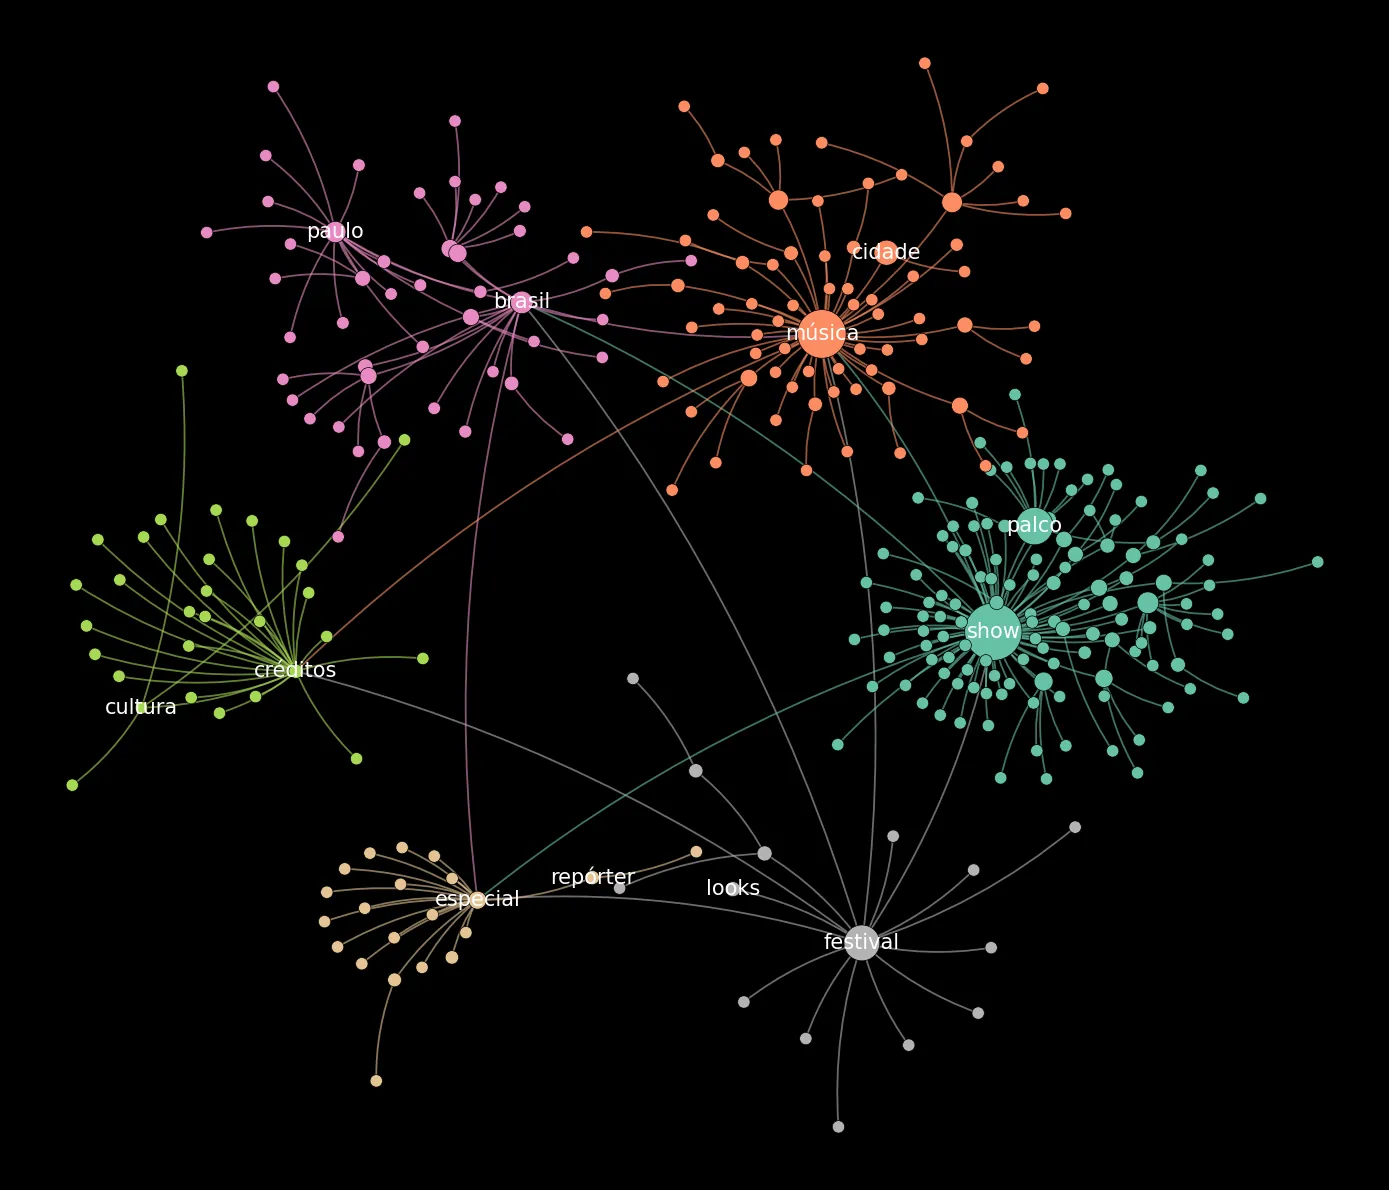
Picture an image that looks like glowing fiber optics intertwining in all directions. That’s what a graph resembles: a visual network where each point represents a relevant element — such as a term or a topic — and each line connecting those points shows the relationship between them. This kind of representation is powerful because it transforms massive volumes of data into visual structures capable of revealing patterns that would otherwise remain invisible. Unlike traditional charts that simply summarize numbers, graphs show how data organizes itself into communities, who holds the most influence, and which paths of information really matter.
The practical value of graphs lies in how they condense complex conversations into accessible visual maps. When applied in brand reports and social listening, they make it possible to identify thematic clusters, see which groups are most tightly connected, and highlight the nodes that act as “bridges” between different communities. This type of analysis answers questions that are hard to capture otherwise: which are the dominant topics? Who connects different bubbles? How do messages spread and gain traction?
From Raw Data to Insight: How Loxias Builds Its Graphs
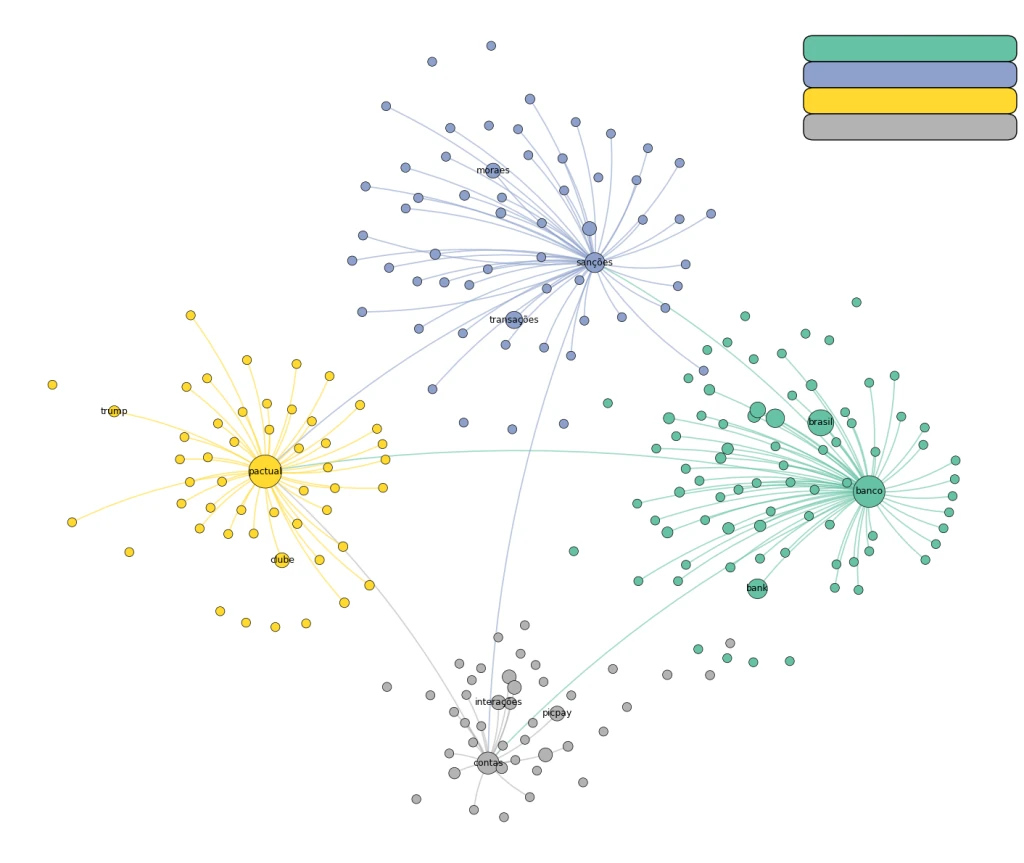
At Loxias, we developed our own methodology to bring this concept into practice and apply it directly to reports. The process begins with data collection and preparation, already converted into graph format. Then, we apply the Greedy Modularity Communities algorithm to divide nodes into dense communities, each highlighted by a distinct color. This makes it easier to read the structure and clearly see which groups or themes form around each cluster.
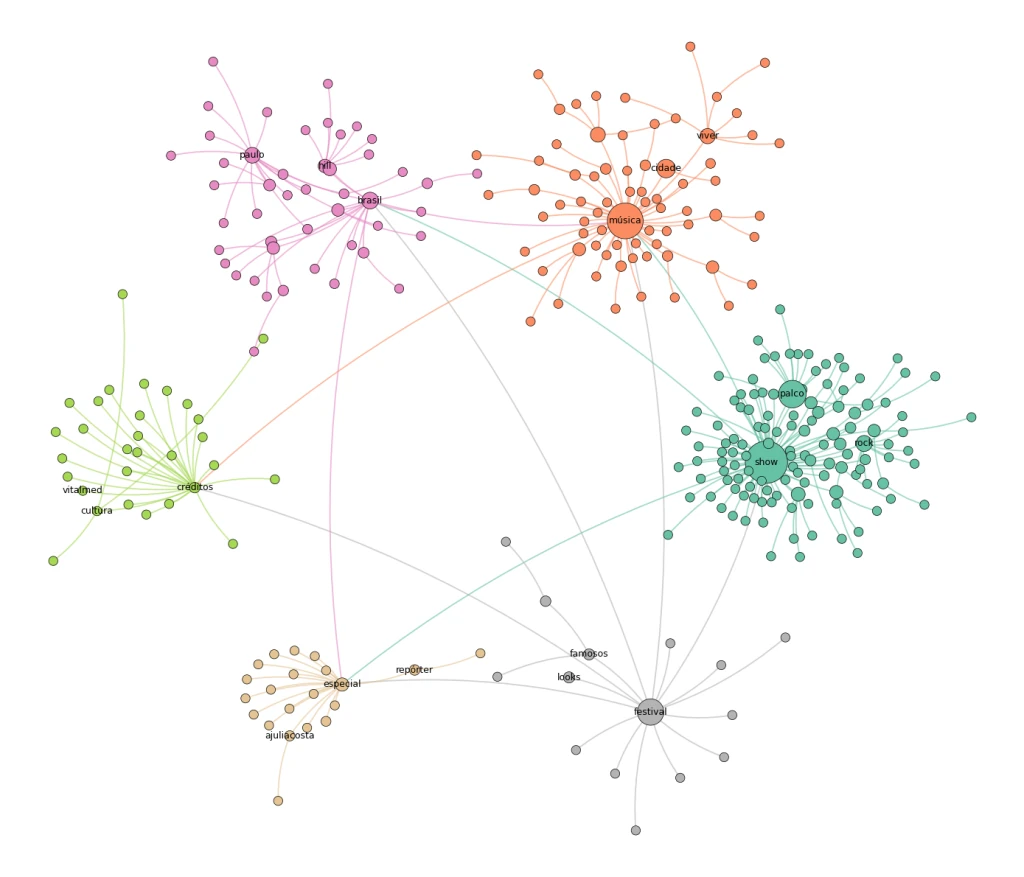
Next, we calculate betweenness centrality to identify which nodes play the most important roles within each community. These points are shown larger on the graph, making it clear who stands out in the network. To structure the layout, we use Kamada–Kawai, which distributes nodes evenly, reducing overlap and making the visualization easier to interpret. The result is not just visually appealing but also clear and functional for extracting insights.
The Role of Artificial Intelligence in Interpreting Social Networks
A key differentiator in the Loxias methodology is the integration of artificial intelligence. We select the ten most central nodes in each community and use these terms as the foundation for large language models, like Gemini, to generate short descriptions that summarize the main theme of each group. This ensures that the graph is not just a web of connections but also a narrative map, where each community has a clear, concise explanation of what it represents.
This interpretive layer is especially valuable because it makes the analysis accessible to audiences who aren’t used to technical metrics. Instead of only seeing colors and lines, the reader can easily understand what themes are being discussed, who the central players are, and how different conversations connect.
An Evolving Methodology: Advances in Community Detection and Explainable AI
Another important aspect is that this methodology is constantly evolving. With each new project, Loxias refines parameters, tests algorithms, and explores new visualization approaches. We incorporate recent advances in community detection and explainable AI, always with the goal of improving accuracy without sacrificing clarity. This means every graph we deliver is not just a finished product, but part of an analytical practice that is continuously improving.
Why Graph-Based Analysis Is a Game Changer for Business Intelligence
The impact of this methodology goes far beyond aesthetics or neat data organization. For companies, reports that include graphs represent a true paradigm shift. They allow teams to spot reputation risks earlier, highlighting clusters of negative conversations before they escalate into crises. They uncover engagement opportunities, showing emerging themes or communities that can be activated in campaigns. And they point to strategic actors — profiles, terms, or ideas that act as catalysts in the narrative.
The ability to turn scattered data into clear maps of relationships makes graphs a genuine game changer for business intelligence. They don’t just provide a snapshot of what has already happened — they help anticipate trends, guide communication strategies, and support decision-making with evidence rather than guesswork. For managers and analysts, that means fewer assumptions and more clarity at the moment of action.
In the end, graphs are more than a visual resource: they are a powerful language that translates the complexity of the digital world into tangible insights. And it is this transformation — from raw data into applicable knowledge — that makes them such a strategic differentiator in Loxias reports and analyses.
Sources consulted
- NetworkX Documentation (2023–2025) – graph concepts and practical applications.
- Scientific Reports (2023–2024) – advances in modularity and centrality metrics.
- igraph Documentation (2024–2025) – layouts and visualization algorithms.
- Springer Journal of Big Data (2024) – reviews on graph learning and interpretation.
- LREC-COLING (2024) – use of LLMs for topic labeling and explainability.